28 Mart 2012 Çarşamba

SCOM alert notification subscription delay sending for x minutes and don’t sent if alert is auto-resolved within that time

In my company we are using SCOM for monitoring our server environment.
Off hours we also get notified about critical alerts using a SMS/GSM modem.
Using default SCOM functionality we delay the sending of notifications by 5 minutes. This works fine for alerts with a “new” state.
However if an alert is closed within the 5 minute period a “closed” notification is sent out.
We do not want to see the closed alerts if an alert auto-resolved within the 5 minute time period. But if a new alert that has aged 5 minutes and sent to our GSM, we definately want to see that closed alert if it auto/manual resolves into the closed state (to make sure someone actually did something about the alert)
Using default SCOM functionality, this is not possible. This is why we came up with the following idea (special thanks to my colleague Frank):
  • Using two seperate subscriptions, one for “new” alerts and one for “closed” alerts.
  • On the new alert subscription set a channel with a powershell script to update custom field 1 when a SMS has been sent (this subscription has the 5 minute delay)
  • On the closed alert subscription set a condition to check custom field 1 to see wheter a SMS has been sent or not.
This blog post describes how this can be done within SCOM.

1. The Command Notification Channel
First we have to create a “Command Notification Channel”. Go to the “Administration” section of the SCOM management console. Click on Notifications->Channels.
Right click and select “New->Command…”.
The following wizard appears:
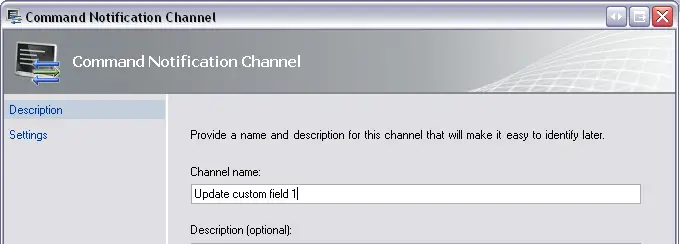
Command Notification Channel Wizard #1
Give the channel a name, and click “Next >”
Enter the following settings for the channel:
Full path of the command file:
C:\Windows\System32\WindowsPowerShell\v1.0\powershell.exe
Command line parameters: -Command “& D:\Scripts\UpdateAlertCustomField.ps1 -alertid:”$Data/Context/DataItem/AlertId$”"
Startup folder for the command line:
D:\Scripts
Change D:\Scripts to reflect your PowerShell script location. It should now look like this:
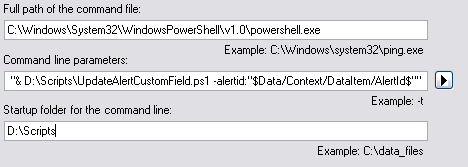
Command Notification Channel Wizard #2
Save the changes by clicking “Finish”
2. The used PowerShell script
To modify alert “custom field 1″, I use a small PowerShell script. The text written into the field is “Notification sent out”
The used script is displayed here, save this script as “UpdateAlertCustomField.ps1″ in the directory specified in the command notification channel above.
01
02
03
04
05
06
07
08
09
10
11
12
13
14
15
16
# Get alertid parameter
Param($alertid)
$alertid = $alertid.toString()
# Load SCOM snap-inn
add-pssnapin "Microsoft.EnterpriseManagement.OperationsManager.Client";
$server = "localhost"
# Connect to SCOM
new-managementGroupConnection -ConnectionString:$server;
set-location "OperationsManagerMonitoring::";
# Update alert custom field
$alert = Get-Alert -id $alertid
$alert.CustomField1 = "Notification sent out"
$alert.Update("Custom field 1 updated by UpdateAlertCustomField script")
3. A subscriber for the command
The next step is to create a subscriber which has the command notification channel created above assigned as channel.
Go to the “Administration” section of the SCOM management console. Click on Notifications->Subscribers.
Right click and click “New…”
In the “Notification Subscriber Wizard” give the new subscriber a name. In the next step of the wizard, specify your schedule as desired.
On the “Addresses” step, click “Add…” to add a new address.
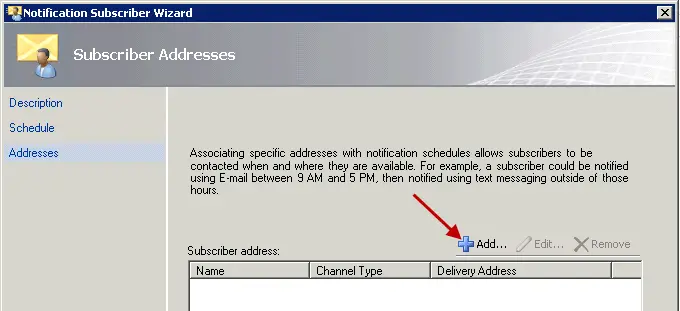
scom_notsub_add
In the “Subscriber Address” wizard, specify a name for the new subscriber. This can be virtually anything as no e-mails/pages/SMS messages are sent anyway.
Next, specify the “Command” channel type and select the Command channel we created earlier (Update custom field 1).
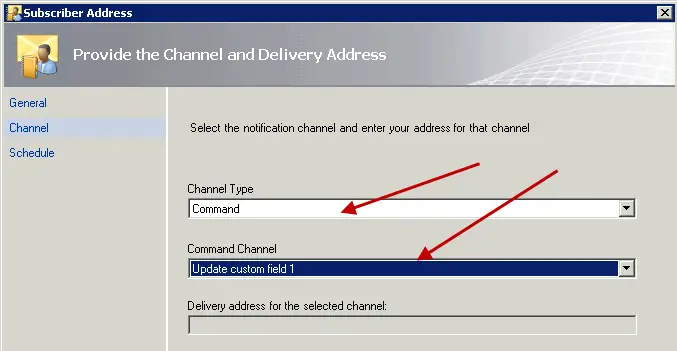
scom_subaddr
Specify your schedule as desired, click “Finish” to end the wizard. Click “Finish” again to close the “Notification Subscriber Wizard”.
You should now have a subscriber with the command channel as asigned channel.
4. The subscription for new alerts
Now that we have the command notification channel, powershell script and subscriber ready. We can create a new subscription for new alerts.
Go to the “Administration” section of the SCOM management console. Click on Notifications->Subscriptions.
In the “Notification Subscription Wizard” specify a name for the new subscription. The next wizard step is the step to define criteria for the subscription.
Specify atleast the “with specific resolution state” criteria, offcourse you can add your own other criteria here like you would normally do.
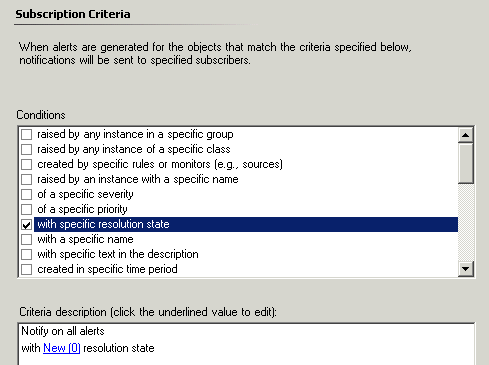
scom_notsub_wi
On the next wizard page (Subscribers) add the command subscriber we created in step 3, as shown below.
scom_subaddr_wi2
In the next wizard step (Channels) add the command channel we created in step 1 and specify the desired delay (5 minutes in this case). As shown below:
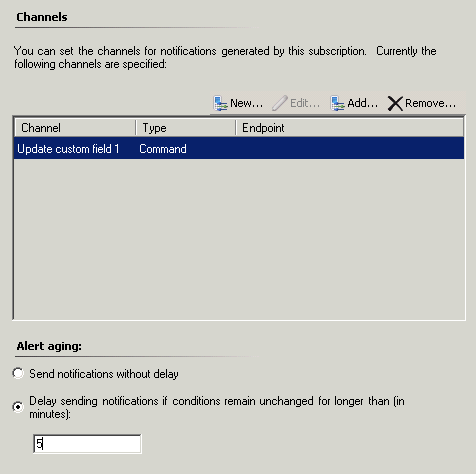
scom_delay
Click “Next”, in the summary step make sure “Enable this notification subscription” is checked and click “Finish”.
You should now have an subscription ready for new SCOM alerts.
5. Subscription for closed alerts
You can create the subscription channel like you would normally do. The only important step is to get the criteria right. We have to include custom field 1.
This is how the closed subscription criteria look:
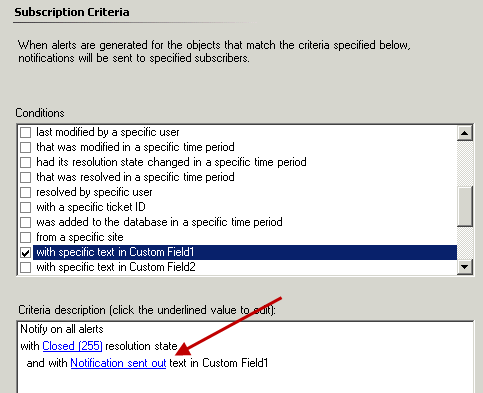
scom_notcustom
NOTE: there is currently a bug in SCOM R2 when using custom fields in a subscription criteria!
For more information about thihs bug visit the following URL:
http://social.technet.microsoft.com/Forums/en/operationsmanagergeneral/thread/260be16a-0f45-4904-8093-7c1caa5ed546
You have to update the xml file each time you change something in either of the notifications!

Maarten Damen
Monitor an Oracle database with a SCOM OleDB watcher

In this blog post I will explain how to use an System Center Operations Manager OleDB watcher to monitor an Oracle database.
This can be useful to monitor a mission critical application on database availability. It’s also a cheap solution to just monitor the connection state of an Oracle database, rather then installing an (expensive) third party Oracle management pack. Off course these packs have a lot more monitors then the connection state, but that might not always be an requirement.
To get this done, the following steps must be taken:

  • Install Oracle client OleDB provider on the watcher node
  • Test the Oracle client OleDB provider, and connection to the database
  • Add OleDB monitoring in SCOM
  • Add associated runas user profiles
Installing the Oracle client OleDB provider on the watcher node
The watcher node can be any machine containing the SCOM agent.
It’s important to have the right Oracle client version (I used version 11), for 32bit versions use the 32bit Oracle client. For 64bit use the 64bit Oracle client version. Both are available on the Oracle website. If you don’t use the correct version (e.g. 32bit on 64bit) you might get “Class unknown” errors within SCOM.
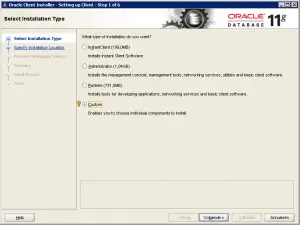
Start the Oracle installation, on the first step in the installation wizard choose “Custom” and click “Next”

On the next page select your favorite language(s), then pick a location for the Oracle client (beware it’s huge, even for one component)
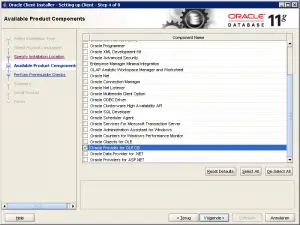
In the “Available Product Components” step select the following component (Oracle Provider for OLEDB:

Finish the installation.
Note:you also need to setup Oracle’s tnsnames file, this is beyond the scope of this article. Consult your Oracle DBA.
Test the Oracle client OleDB provider, and connection to the database
To test a OleDB connection, you can use a UDL file. This is a connection file, which launches a wizard once you click it.
Use the following steps to create an UDL file:
1. Make sure in Windows Explorer, Tools->Folder Options, View Tab, that “Hide file extensions for known file types” is not checked.
2. Right click on Windows desktop, and select New->Text File.
3. Name the file “Test.udl”. The icon for the file should now be the special “UDL” icon.
4. Double click the file to open the Data Links dialog.
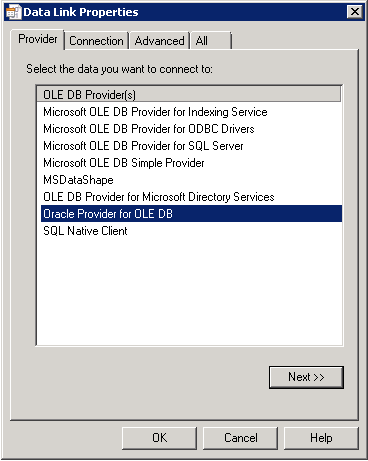
5. Click on the “Provider” tab. Select “Oracle Provider for OLE DB”.

6. Click on the “Connection” tab. In the first dialog box (server name) type the oracle service ID (the name defined in the tnsnames file)
7. Specify the credentials (username and password) in the same dialog box.
8. Click “Test Connection”, you should now see this embracing message :-)

Add OleDB monitoring in SCOM
The next step is to add monitoring to SCOM. Start the SCOM operations manager console and click on “Authoring”.
Within this view, click on “Add Monitoring Wizard” on the left hand side.
To add an OleDB watcher, use the following steps:
1. In the “Select Monitoring Type” step select “OLE DB Data Source”, click “Next”
2. Within the general properties step specify a name for the monitor and choose a Management Pack for your custom monitoring (Microsoft recommends not to use the default management pack here, so create a new one!)
3. In the Connection String dialog click on the “Build…” button. Choose any random Provider (we will change the connection string later on) enter a random computer name and database as well. Make sure you check: “Use Simple Authentication RunAs Profile created for this OLE DB data source transaction”, this is important.

4. Enter Query performance thresholds, if this is required.
5. Within the “Watcher Nodes” step, select the machine on which we installed the Oracle client.
6. Finish the wizard.
You should now end up with an OleDB Data Source within SCOM.
Open the data source and navigate to the “Connection String” tab.
Change the connection string in to the following format:
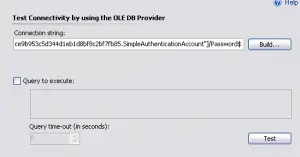
Provider=OraOLEDB.Oracle;Data Source=TEST;User Id=$RunAs[Name="OleDbCheck_b7035c5b5d6149b684df79089e99dc07.SimpleAuthenticationAccount"]/UserName$;Password=$RunAs[Name="OleDbCheck_b7035c5b5d6149b684df79089e99dc07.SimpleAuthenticationAccount"]/Password$
Replace the RunAs variables with the ones generated by the wizard. The data source is the Oracle SID, the same you used to test before. The provider name is the short (internal) name for the Oracle Provider for OLEDB.
Save the OLEDB Data Source.
Add associated runas user profiles
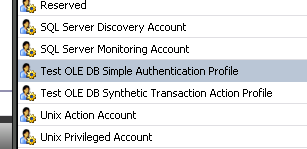
If you checked the “Use Simple Authentication RunAs Profile created for this OLE DB data source transaction” during the wizard you should end up with a preset RunAs profile for this monitor. You can find it under Administration->Run As Configuration->Profiles in the operations manager console.

Double click this “simple authentication” RunAs profile.
To add a “Run As Account” follow the following steps:
1. In the “Run As Profile Wizard” click the “Run As Accounts” tab.
2. Click on the “Add…” button to add an account.
3. Click on “New…”, the “Create Run As Account Wizard” should now start. Skip the introduction.
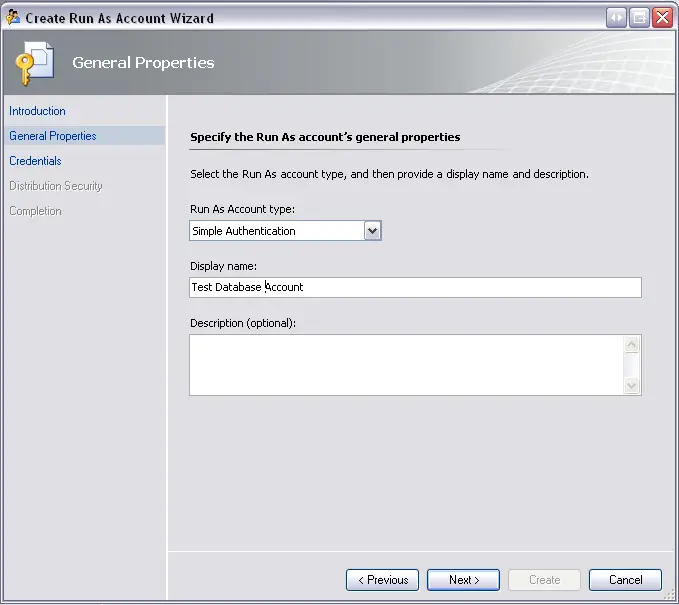
4. On the general properties page, select the run as account type. Set this to Simple Authentication and specify a display name.

5. On the credentials tab specify the account name and password.
6. Select a distribution security option, based on your preference. I used the More Secure option (you need to reopen the account under the accounts pane to distribute it to your watcher node)
7. Finish the “Create Run As Account Wizard”
8. Click “OK” and finish the “Run As Profile Wizard”
You have now configured the Run As profile.
To see the result of all this work, open the “OLE DB Data Source State” view within the monitoring pane. This is located underneath the “Synthetic Transaction” folder.
This could take a while! (It took about 15 minutes in my environment)

Maarten Damen

How to monitor non-Microsoft SQL databases in SCOM – an example using Postgre SQL

OpsMgr has the capability to run a synthetic transaction, to query a remote database from a watcher node. This can be used to simulate an application query to a back end database, and we have built in monitoring to set thresholds for:
  • Connection time
  • Query time
  • Fetch Time
We will also auto-create three performance rules – so that you can collect these as performance data for short term investigation, or long term trending.

In the console, on the Authoring pane, right click “Management Pack Templates” and choose the Add Monitoring Wizard.
image

Select the OLE DB Data Source, give it a name and create or select an existing management pack for your SQL synthetic transaction.
On the Connection String page – typically you would select “Build” and choose from one of our existing built-in providers:

image

This is very simple for running queries against Microsoft SQL servers. However, what if you you need to query Oracle, or some open-source database?

There is a pretty good article on setting this up for an Oracle database here:
http://www.maartendamen.com/2010/09/monitor-an-oracle-database-with-a-scom-oledb-watcher/

My customer recently asked me about running a synthetic transaction against a Postgre Open Source SQL DB, so that will be the source of this article. However – you can use this guidance for any database, as long as there is an OLE DB provider for Windows for that database. The alternative to this – would be to write a custom script, that can query the DB via the scripting language providers, then use the output of the script to drive a SCOM monitor, like via a propertybag, or the event log.

Ok – lets get started.

The first step is to find a Windows OLE DB provider for your database. Download it, and install it on your Watcher node (the agent that you want to run the queries)
For Postgre SQL – I used a trial provider from http://www.pgoledb.com however if you look around I am sure there are other open source providers out there.
Once you install the provider – you should test it to ensure your connections are a success. Create an empty file with Notepad.exe on your Watcher node’s desktop, name it SQL.txt. Then once it is on your desktop, rename it to sql.udl. This UDL file can now launch the OLD DB data link tool, which will show you all your providers. Notice my new provider for PostgreSQL:
image

Select your provider, and choose Next.
Input the servername, port, authentication account, and default database you wish to query, and test the connection. You MUST get this working before even attempting the OpsMgr OLE DB Wizard, because it will simply call on this provider. Here is my example below:

image

Once it is a success – you browse the “All” tab – and see all the parameters allowed by your provider in a connect string:
image

The next step is to configure the OpsMgr Synthetic transaction.

In the “Build” Connection String setting for your OLE DB Datasource, it will not list our custom provider, unless it is installed on the same machine that you are running the console. You could install your provider on your console machine, but I don’t recommend it. The connect strings are very specific and the SCOM wizard does not provide the correct ones in all cases. Therefore – just pick the “Microsoft OLE DB Provider for SQL Server”, provide a server and database name, and make sure you check the box to use Simple Authentication RunAs Profile.

image
The reason we check the box for simple auth is so it will build the RunAs profile and input the username and password variables into the connect string.

Now – on the next screen, highlight everything in the Connection string, copy and past it into notepad

Provider=SQLOLEDB;Server=SRV02;Database=postgres;User Id=$RunAs[Name="OleDbCheck_37d53320a37b48dda11eed3a00caa91f.SimpleAuthenticationAccount"]/UserName$;Password=$RunAs[Name="OleDbCheck_37d53320a37b48dda11eed3a00caa91f.SimpleAuthenticationAccount"]/Password$

We need to modify this line to use the supported parameters of our SQL provider. You should be able to get this information from the provider documentation, from the Data Link Properties tool we used above, or from examples on the web. In my case – I will use the provider documentation

Provider=PGNP.1;Initial Catalog=postgres;Extended Properties="PORT=5432";User ID=$RunAs[Name="OleDbCheck_37d53320a37b48dda11eed3a00caa91f.SimpleAuthenticationAccount"]/UserName$;Password=$RunAs[Name="OleDbCheck_37d53320a37b48dda11eed3a00caa91f.SimpleAuthenticationAccount"]/Password$

In the example above – my provider uses a name of “PGNP.1”, the initial catalog is the database I want to query, and I specify the port. I did not specify the server name, because my watcher node is the same computer that hosts the database, otherwise I would have a value for the server host name.
Once you have a well formatted connect string, the next step is to input your test query and give the workflow a timeout of when to quit and kill the query:

image

Running a “Test” will fail – because the test is not run from the watcher node – it is run from the RMS, which does not have these special providers installed, so skip that.

Configure alert thresholds for your expected query results:
image

Choose your watcher node and how often you want the query to run. Don’t run these synthetic transactions too often, if you have a lot of them they can overflow the watcher node agent, or create a performance impacting load on it.

image

You can now finish and create your transaction. The watcher node will get instructions to download this management pack, and it will begin running the transaction. You can inspect the progress in the console under Synthetic Transaction, OLE DB Data Source State:

image

Soon Health Explorer may show as critical:

image

This is because we haven't configured the RunAs accounts, for simple authentication to gain access to the database.

In the console, under Administration > Run As Configuration > Accounts. Create a Run As Account. Choose Simple authentication and supply a name:
image

Provide a credential:

image

Always choose More Secure:

image

Under Accounts, open the properties of the account you just created. Go to the Distribution Tab – and you need to allow your watcher node to use this credential by distributing it to your watcher:

image

image

Now we need to associate this account we created, to the Profile that our Synthetic Transaction uses. Select Profiles, and find the name of the Simple Authentication Profile that matches the name of our OLE DB Synthetic transaction:

image

Open the properties of this profile, and add our newly created account to it:

image

This will update the Secure Reference management pack, and this credential will flow down to our watcher node, and subsequent attempts to monitor our database will pass this credential, instead of trying to use the default agent action account to authenticate (local system).
After a few minutes, you should see Health explorer clear up and show a successful connection:

image

If you want to validate that you are collecting performance data – right click your OLE DB Synthetic transaction in the monitoring pane > Open > Performance View:


image

image

As you can see – as long as there is a provider for Windows for the agent to consume, we can synthetically query remote databases of any type, authenticate to them securely, and bring back good performance data to proactively show query or connect performance issues, and react to outages immediately.

Kevin Holman